The HEMU tutorial page
This page features a brief instruction on the five toolkits of HEMU
and modules inside the toolkits.
This page features a brief instruction on the five toolkits of HEMU
and modules inside the toolkits.
This is a simplified version of our user manual, with the purpose of helping users have a quick glance of the main functions regarding toolkits and modules in HEMU.
If you want to perform advanced or customized analyses using the platform, be sure not to miss our DETAILED USER MANUAL
HERE.
HEMU has a user-friendly graphical interface that allows users to effortlessly explore genomic data across various representative Andropogoneae species with just a click. Leveraging a total of 4287 RNA-seq datasets from the public database, we applied a widely recognized transcriptome analysis process to construct 73 significant genomes of the Andropogoneae tribe.
We have designed four distinct search toolkits for users to utilize. Our server infrastructure is built on Django, MySQL, and Shiny technologies. You can conveniently access various types of visual analysis results (further details provided below).
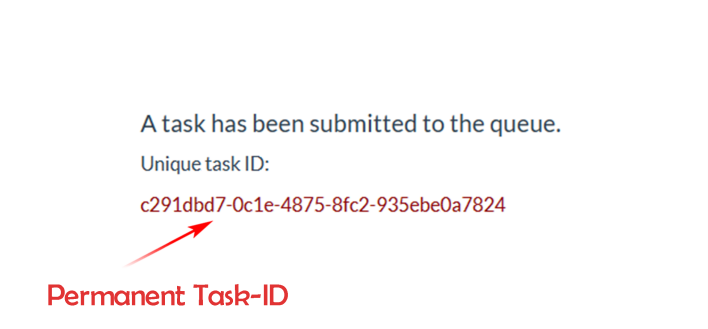
This Task ID will be visible in the URL and will remain effective indefinitely. Therefore, you have the option to save the Task ID and retrieve its associated results whenever needed.
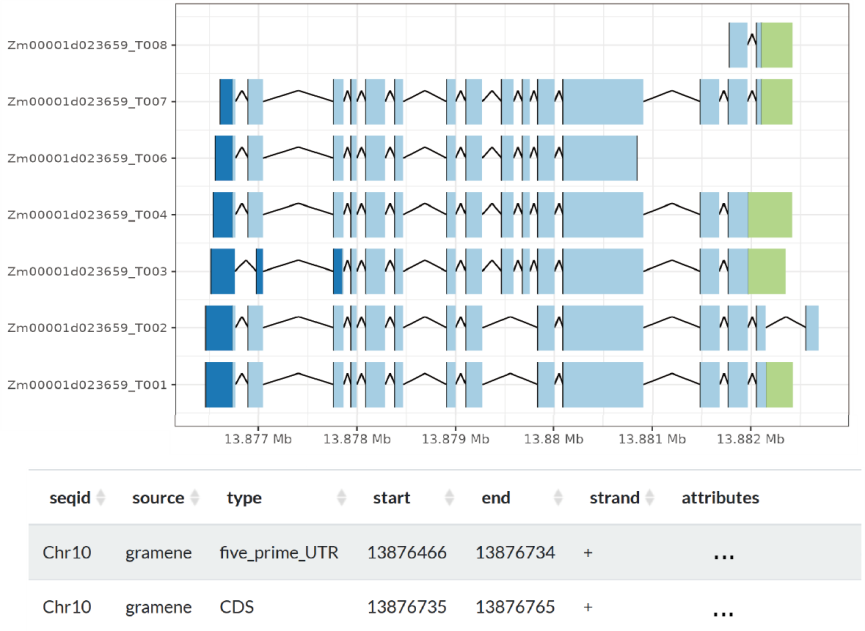
This page is to Visualize transcript-level gene structures, allowing you to explore the gene structure of representative Andropogoneae species. It will provide you with details about the major transcript, CDS (Coding Sequences), UTR (Untranslated Regions), and other structural information associated with the specified gene.
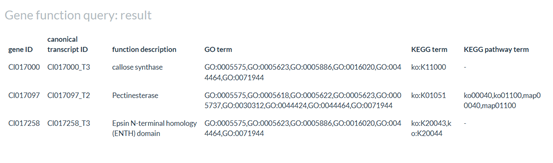
This page is to explore gene functional annotations across RNA-seq samples that are part of the HEMU catalog. A table will display comprehensive information, encompassing the primary transcript ID, a concise functional description, as well as GO/KEGG term and KEGG pathway term details.
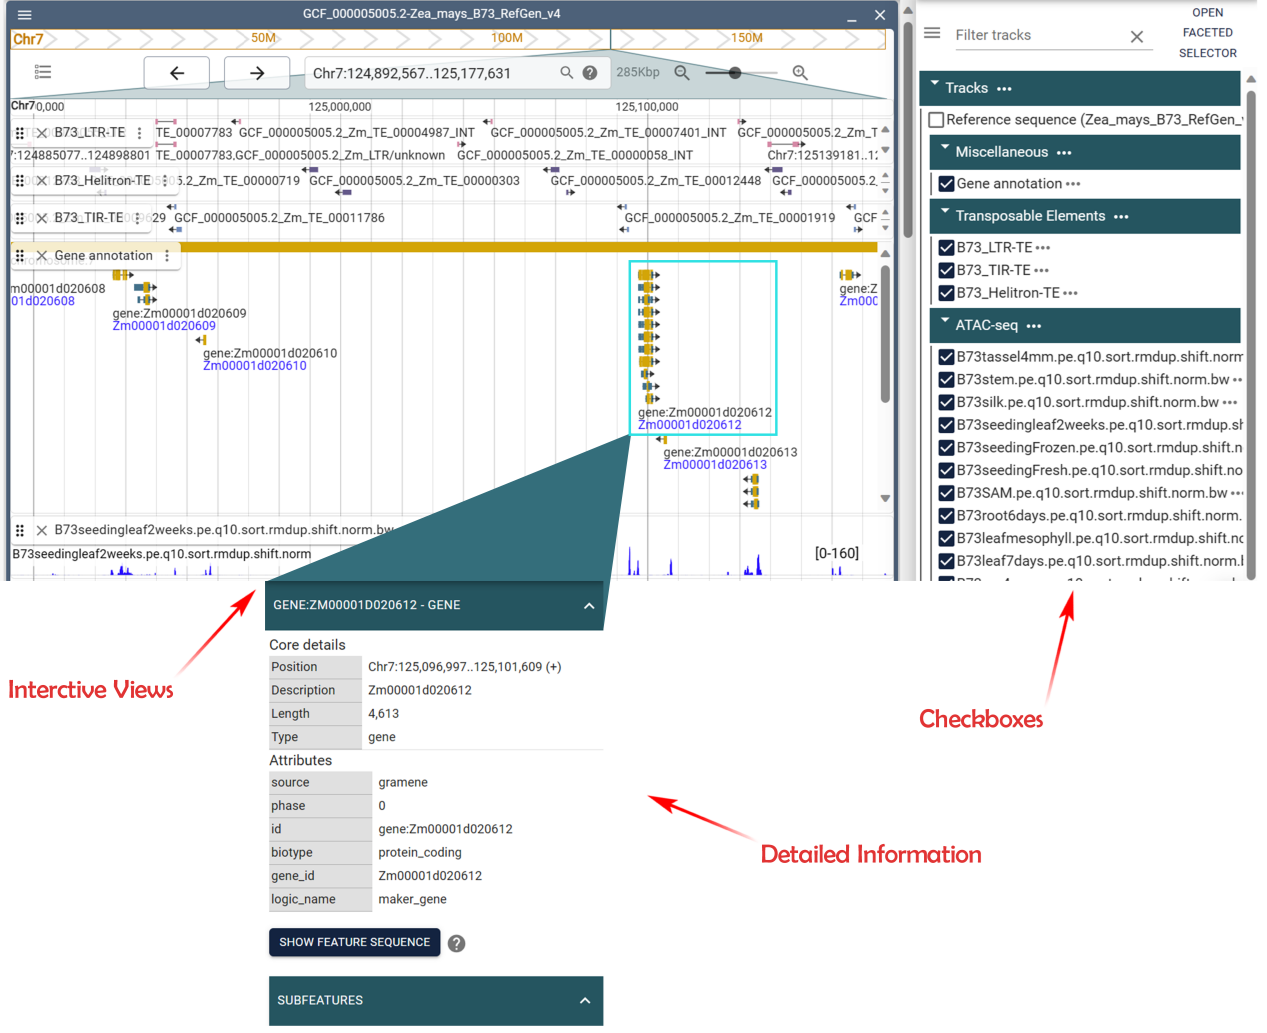
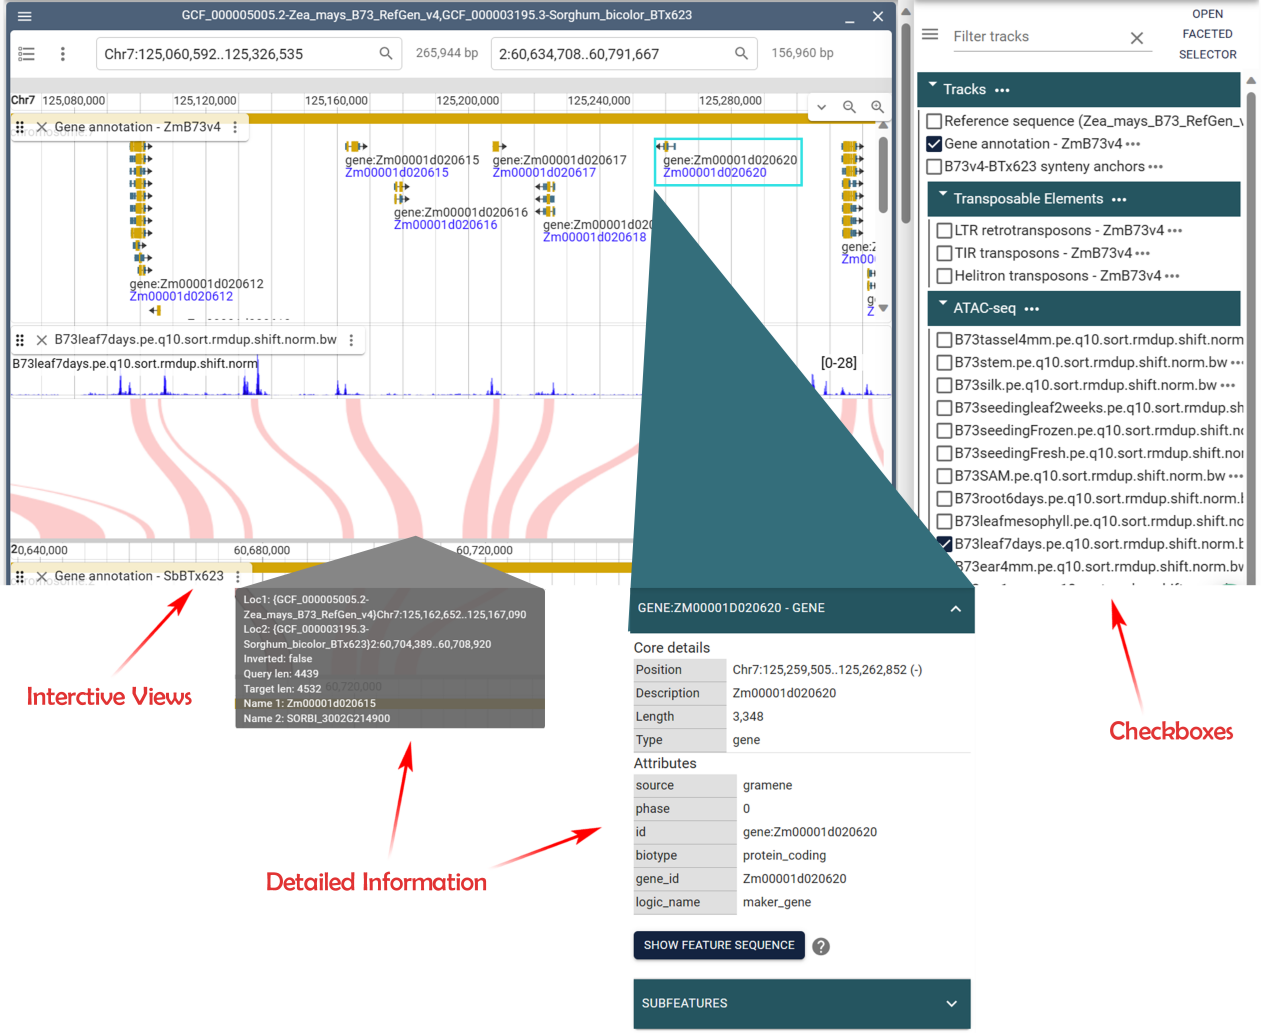
This page is designed to showcase visualized genomic data for individual species that have been processed. A total of 9 species are available, and custom parameters can be applied to visualize Multi-omics genome data in a linear view.
This page is to show synteny analyses among three pairs of species and have visualized the results for user convenience. Click on the green link below each species to view the synteny results for that specific pair of species.
We have incorporated part of the BLAST search engine framework from Sequance Server (sequenceserver.com) and supplemented it with nucleotide and protein databases assembled for our species. By selecting the relevant database information, you can obtain alignment results(please see user manual page 9, section 2.5).
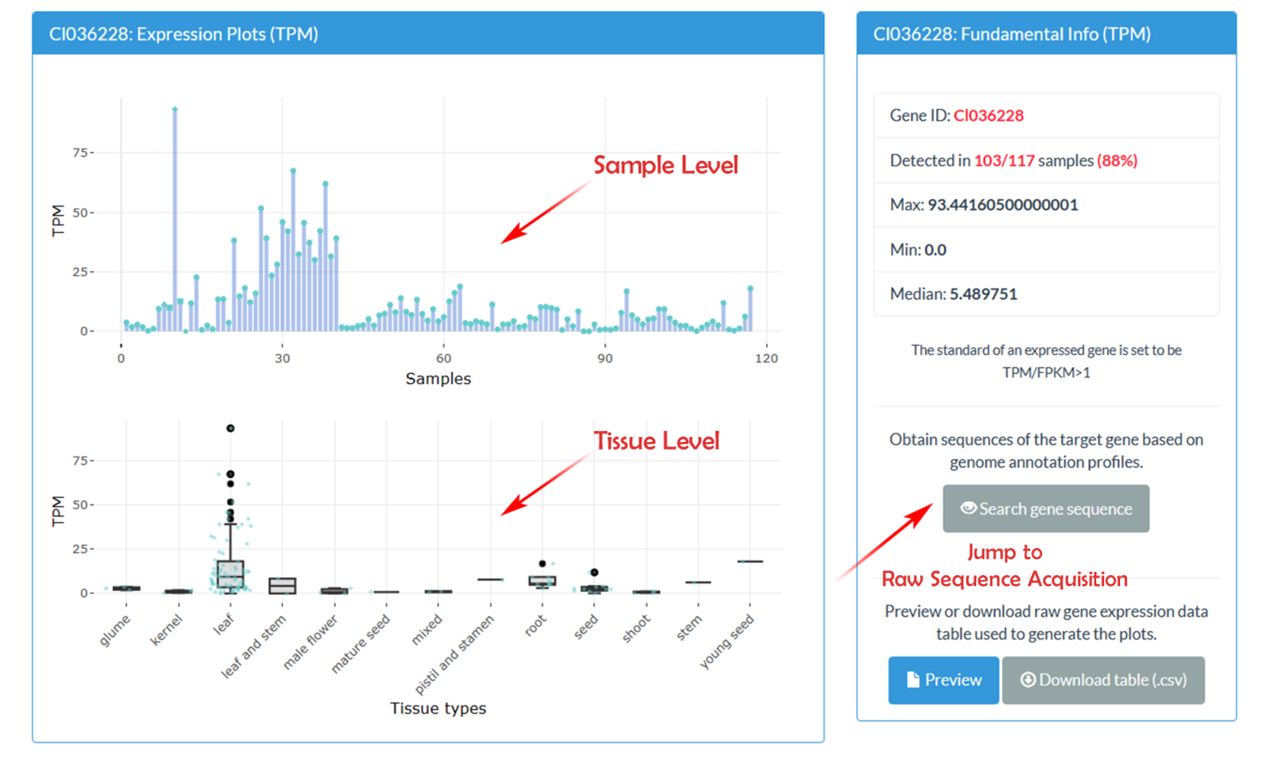
This module provides an Online Query Module for gene expression in the Andropogoneae transcriptome database. The results presented through two panels showcasing gene expression profiles.
This module is to retrieve gene, transcript, or protein sequences associated with your chosen Gene ID. FASTA-formatted sequences can be displayed for the results (please see user manual page 11, section 3.2).
This module offers a comprehensive platform for Differential Gene Expression (DGE) Analysis, which can investigate the variations in expression across different tissues or organs. A comprehensive set of analysis results categorized into four distinct sections, include Project summary, Overview & Normalization of Expression Data, Principal Component Analysis and Differential Analysis, can be presented (please see user manual page 12, section 3.3).
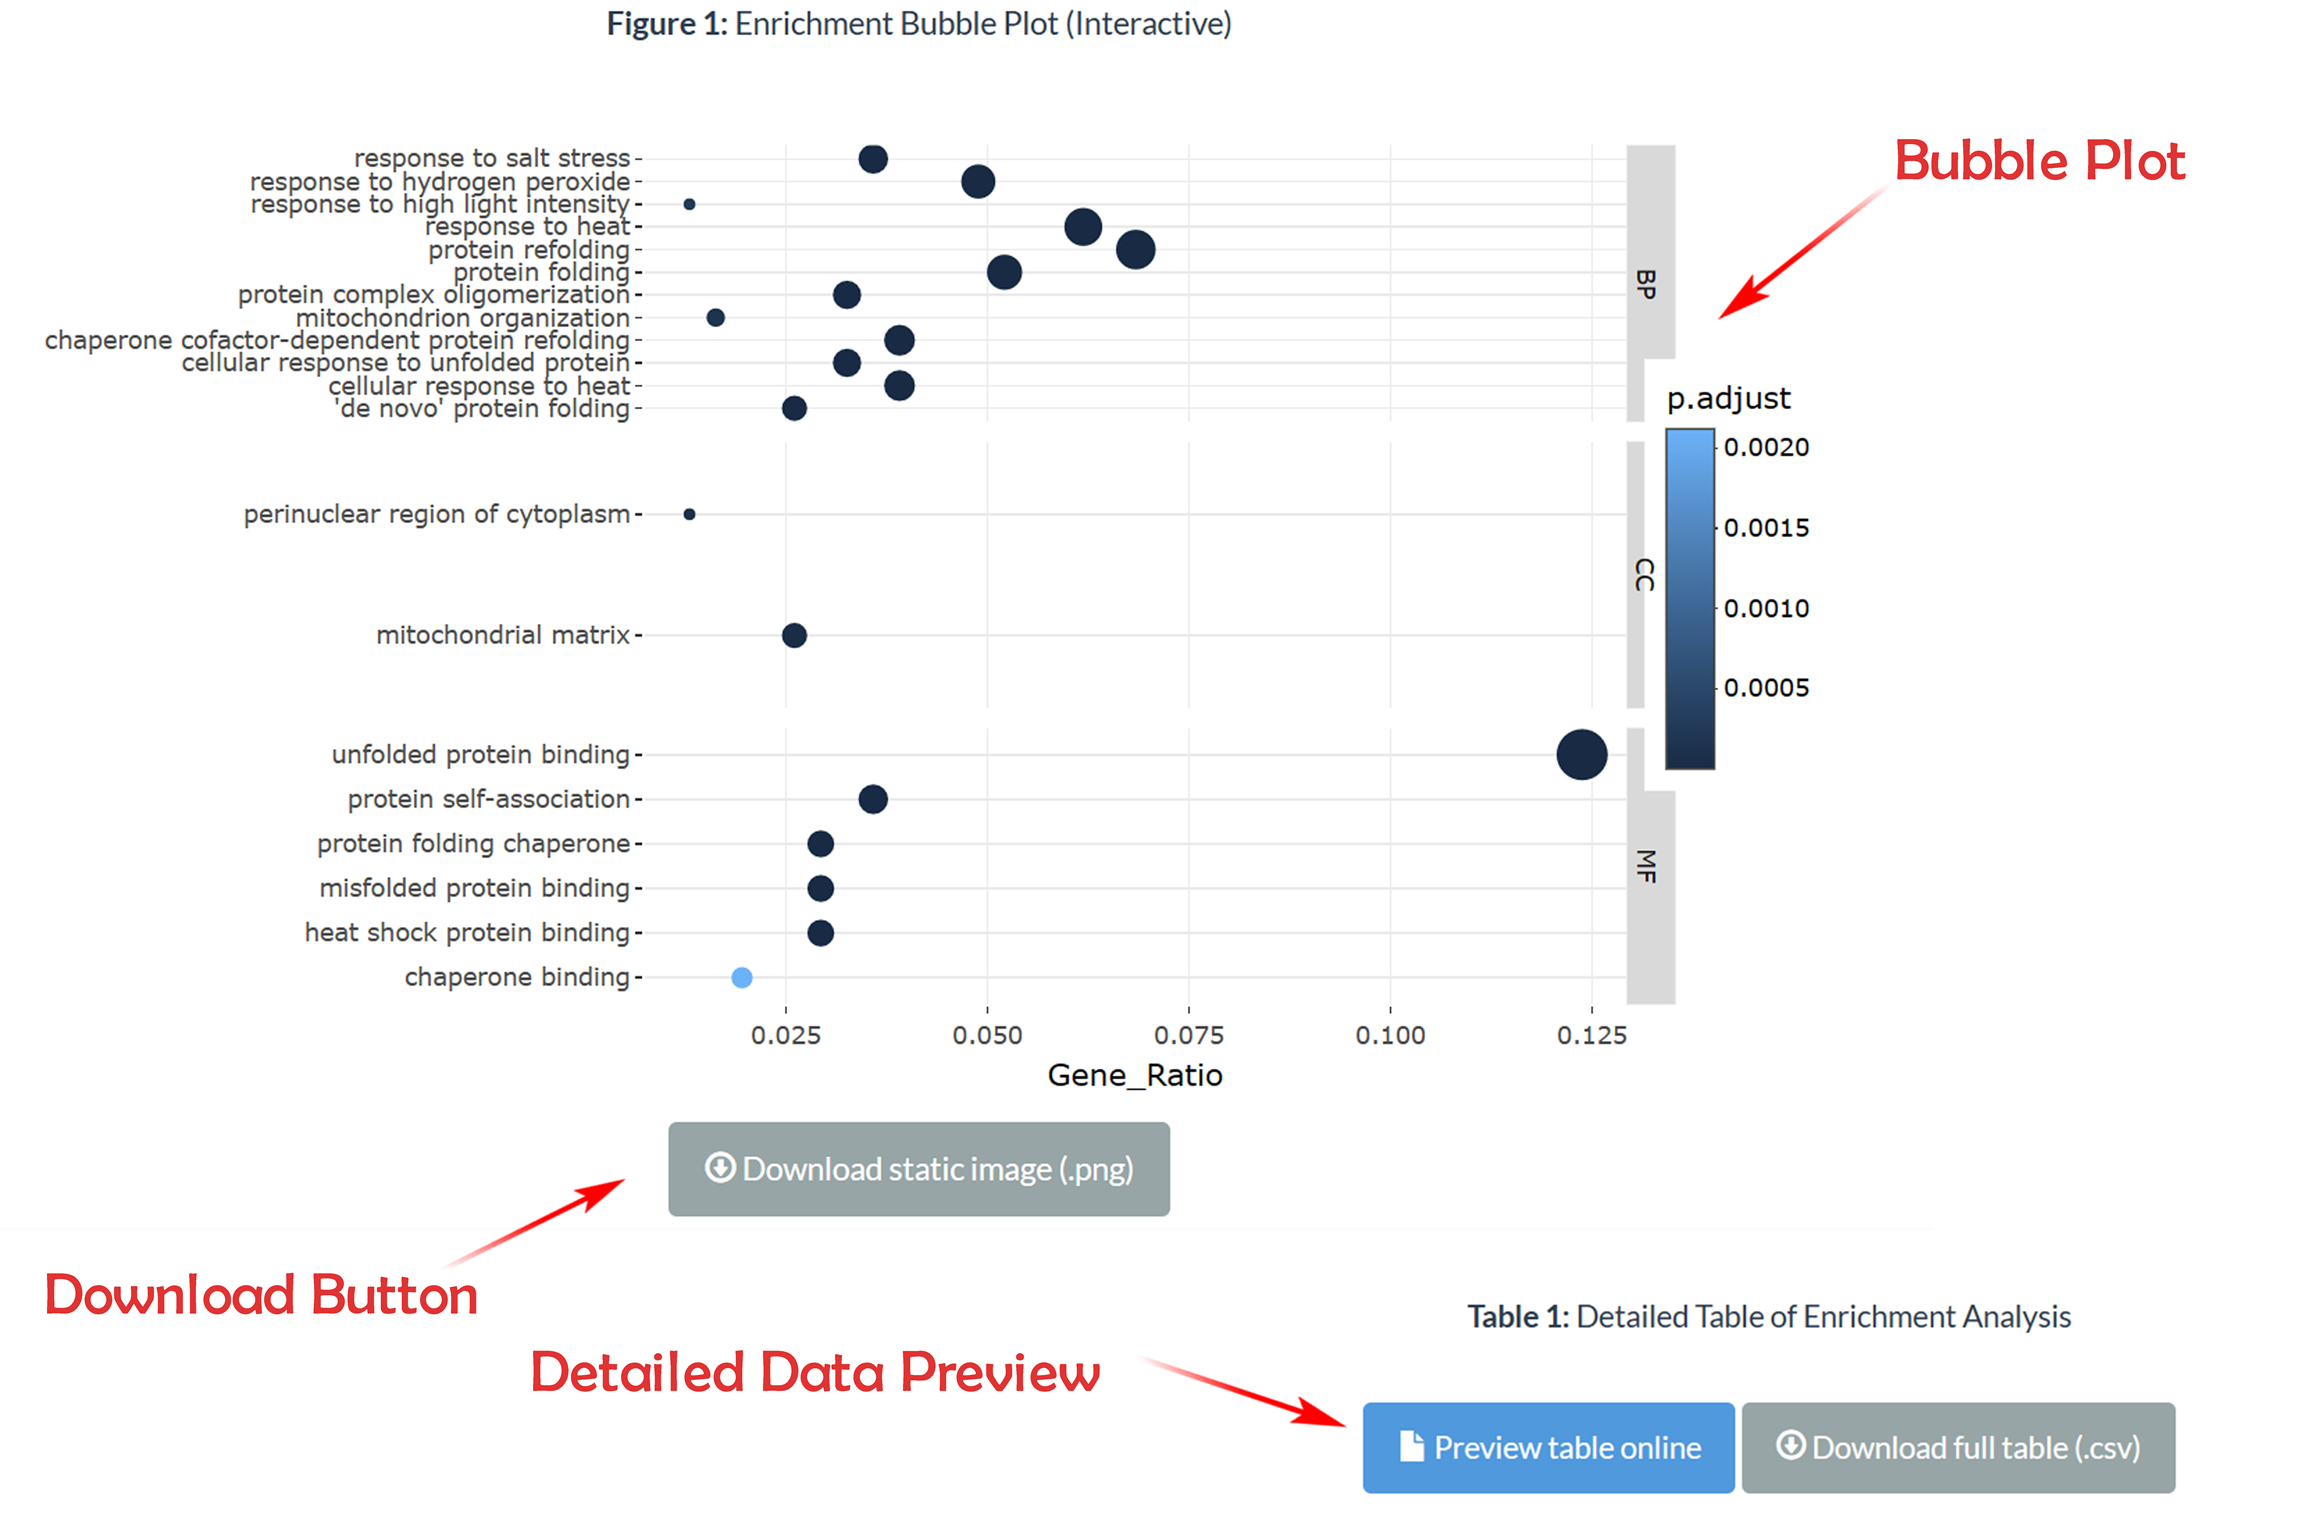
This module enable users to explore functional annotation details of gene transcripts in representative Andropogoneae species. The table contains comprehensive data from the Enrichment Analysis, and it includes options for previewing and downloading the data.
This module divides the overall WGCNA process into three sections. Section 1 covers Data curation, filtering, and sft selection. Section 2 involves Co-expression network construction, and Section 3 focuses on Module-trait correlation analysis. It's noteworthy that the analyses in Section 2 and Section 3 are relatively independent, as you will observe from the subsequent workflow (please see user manual page 15, section 3.5).
This module offers two distinct gene sequence alignment methods (HMM and BLASTP) to cater to the requirements for identifying shared domains and distinctions within the gene sequences (please see user manual page 17, section 4.1).
This page offers a phylogenetic analysis toolkit for the automatic construction of a foundational tree, which can help elucidate the evolutionary and genetic connections among ta set of potential genes (please see user manual page 19, section 4.2).
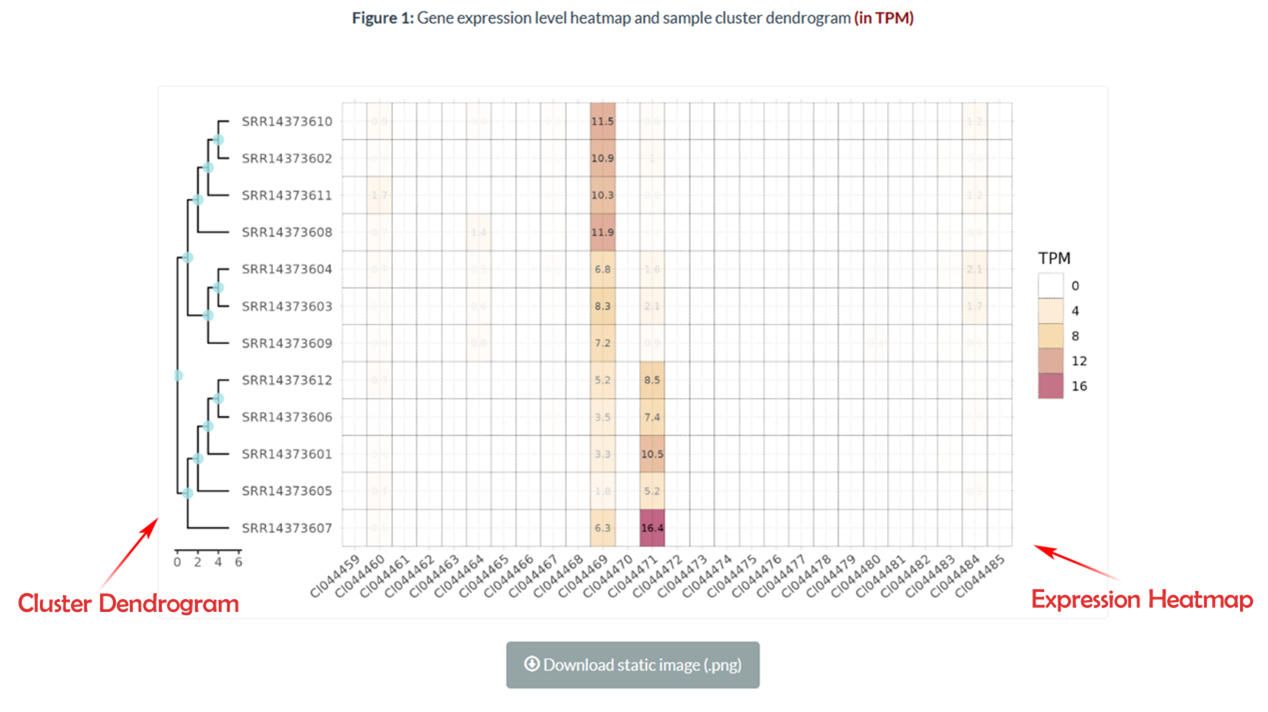
A heatmap generation tool designed is offered to help you visualize your gene family data. The system will display a visual representation comprising a heatmap depicting gene expression levels and a dendrogram illustrating sample clustering. This will be accompanied by a comprehensive table showcasing the gene expression data across various samples.
This page provides two methods for querying TEs in genomes, which can help researchers identify where TEs are inserted, their classifications and putative biological functions in the genome.
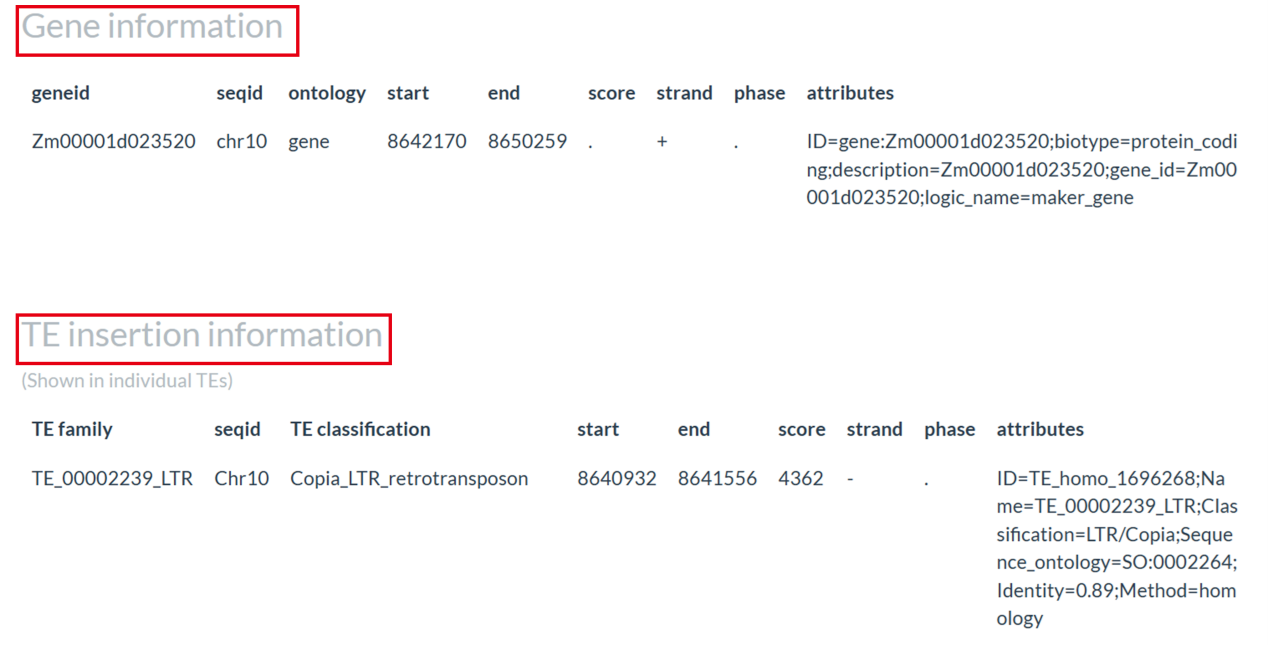
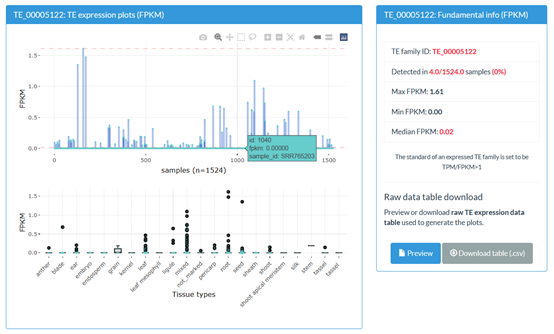
TE expression data of representative Andropogoneae species has been analyzed and an interactive query interface has been provided. During our analysis, individual TEs are classified into families based on the 80-80-80 rule proposed by Wicker et al. That is, two elements belong to the same family if they share 80% (or more) sequence identity in at least 80% of their coding or internal domain, or within their terminal repeat regions, or in both. The results conclude two panels of the gene expression profiles for every TE ID.
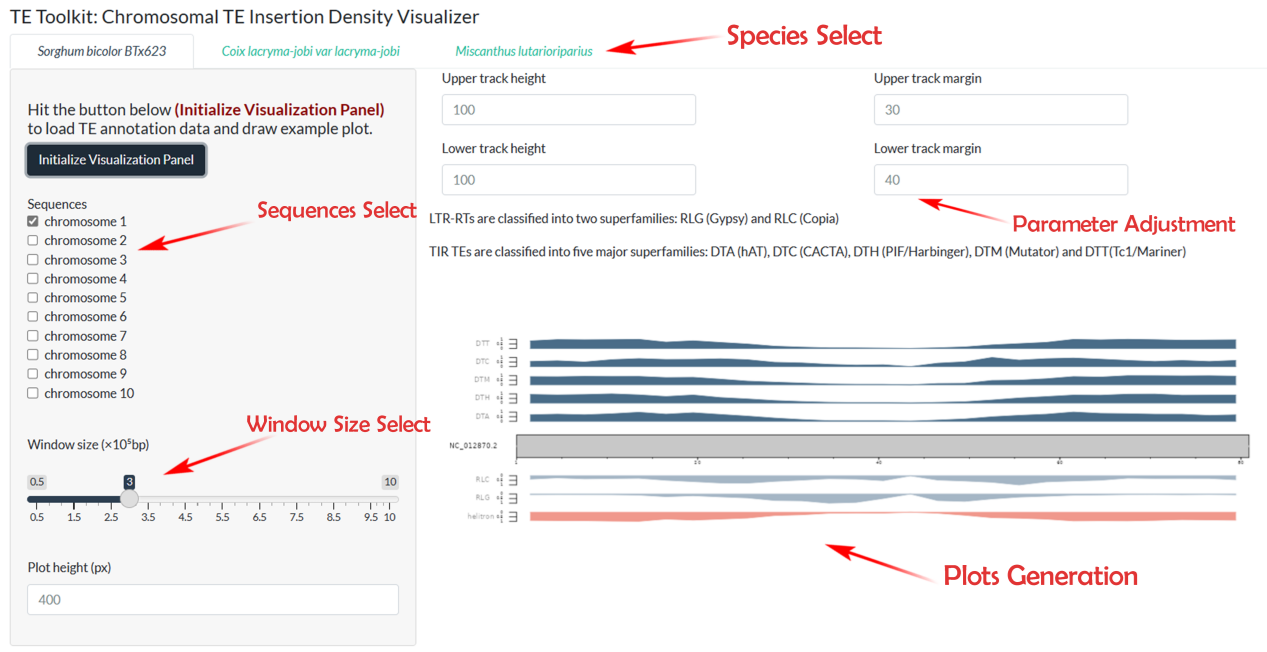
This page provides an interactive TE Chromosomal Distribution Search platform, which calculates the number of TE on chromosomes to determine their distribution and study their role in genome structure and function.
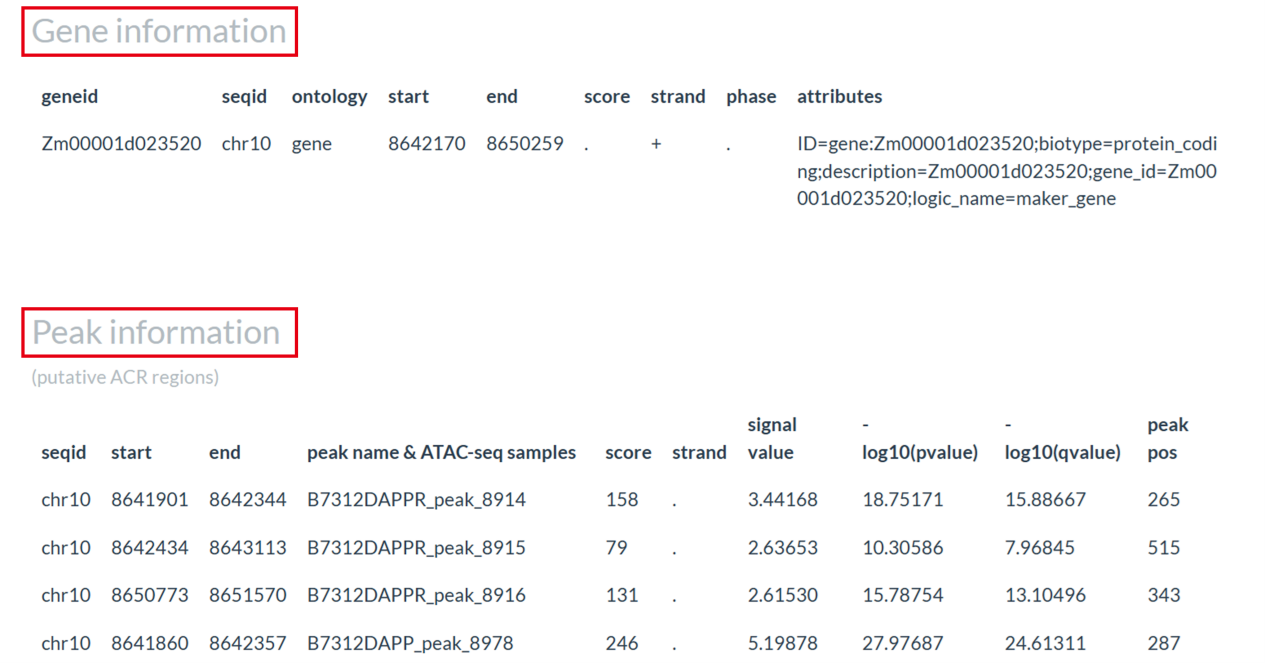
This page provides two ways to search for open chromatin regions, both of which will return relevant information on all open chromatin regions at that location. About the results, a table of the information of all chromatin regions in what you query will be provided, including its start and end, score, p-value and so on.
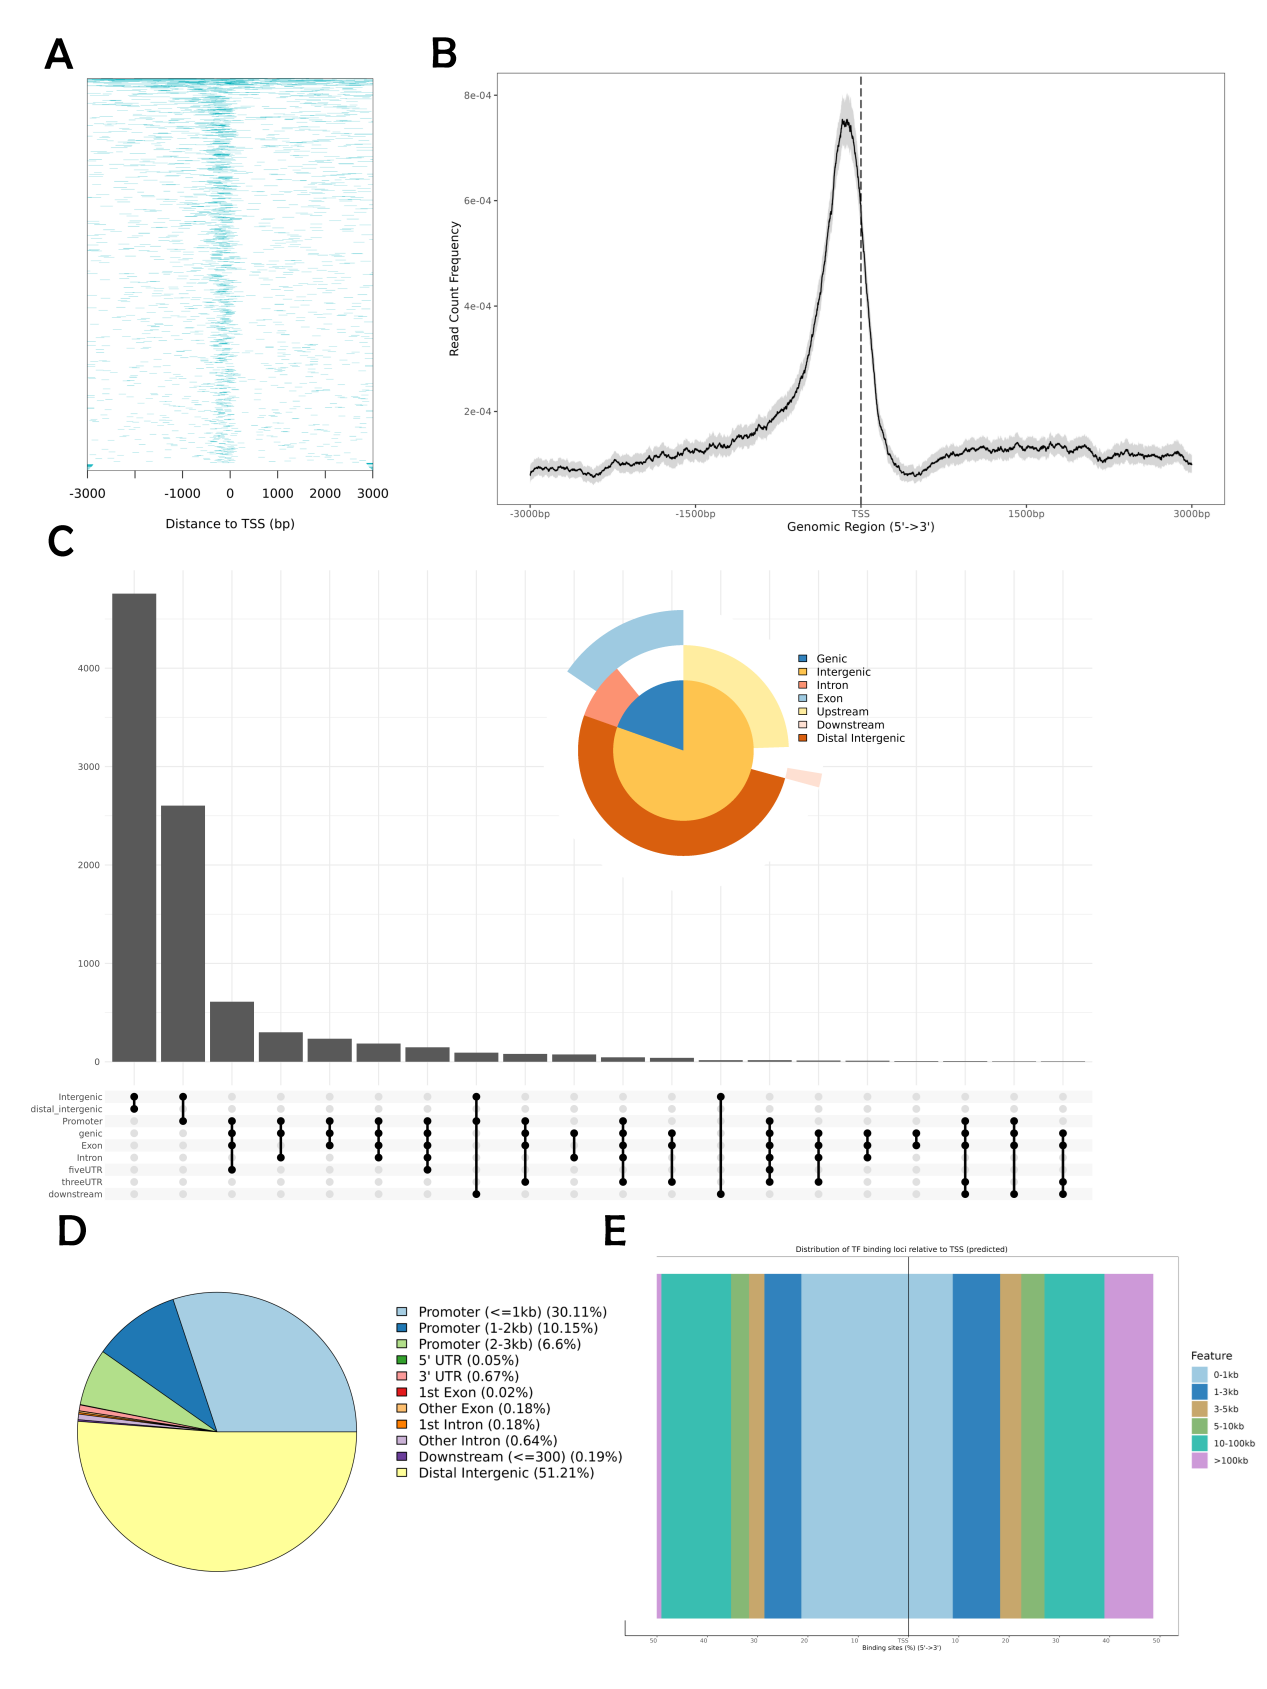
This page is to show a database for ChIP-Seq data of representative Andropogoneae species we built and the entire process of ChIP-Seq peak annotation analysis we streamlined. The results of the analysis include five subgraphs: Heatmap, Density Map, Venn Plot, Pie Plot and TF Binding Loco Distribution Map (please see user manual page 27, section 6.2).
All data used for display and visualization has been categorized into three sections here: Genomic Resources, Transcriptomic Resources, and Epigenomic Resources.
This section contains some useful and essential links to other databases related to the project.